
Fort Myers Housing Inventory Levels 2026 and When to Buy

More listings don’t automatically make Fort Myers a buyer’s market. Fort Myers housing inventory levels for 2026 show a mixed picture: single-family homes had 4.47 months of supply in September, below the six-month benchmark for a balanced market.
That can give buyers more room to compare options than in a tight market, but a single inventory figure cannot describe every home or neighborhood. Supply varies by property type and location, and metro-wide counts may tell a different story from Fort Myers single-family data. Assess each property on its own merits rather than assuming every listing offers the same negotiating leverage.
This article explains how months of supply can indicate market balance, what regional listing trends reveal, and how Southwest Florida’s outlook may affect your timing. Use this framework to decide whether to act or keep watching, based on the type of home and area you’re considering.
Table of Contents
Is Now a Good Time to Buy a House in Fort Myers?
The strongest named area-level inventory signal is Bonita/Estero, with 2,206 active listings in January 2026. That is a submarket, not a ranking of Fort Myers neighborhoods. The Cape Coral-Fort Myers metro figures combine listings across the wider area.
Active listing counts can vary across the wider metro area. Counts fell to 9,834 in July, then 9,351 in August. September reached 9,173 listings before October climbed to 9,635. These monthly totals exclude pending listings, so they measure homes still actively available rather than all homes under contract.
Fort Myers single-family inventory followed a different pattern. The city had 1,512 active listings in July and 1,504 in August. September increased by 44 listings, reaching 1,548. Supply stood at 4.47 months that September. About 21% of active Fort Myers listings had recently seen price reductions, a sign that some sellers adjusted pricing. Fort Myers homes averaged 93 days on market in September, giving buyers time to assess options.
Bonita/Estero recorded 2,206 active listings and 9.1 months of inventory in January 2026. Year over year, those figures were down 8.6% and 23.5%, respectively. New listings moved the other way: 668 came to market, up 41.8% year over year. These shifts show why buyers should compare the submarket and property type, not rely on a single regional trend.
So, does the market favor buyers? The active choices, longer marketing periods, and price adjustments create room to evaluate listings carefully, but conditions vary by property. A realtor can help interpret pricing and days-on-market trends for a target area. For Fort Myers housing inventory levels in 2026, the practical takeaway is to weigh current listings against location, home type, and how quickly comparable properties are moving.
Bonita/Estero had the strongest named area-level inventory signal, with 2,206 active listings in January 2026. That is a submarket, not a ranking of Fort Myers neighborhoods, and the section provides no neighborhood-by-neighborhood counts.
Months of housing supply and buyer-market thresholds
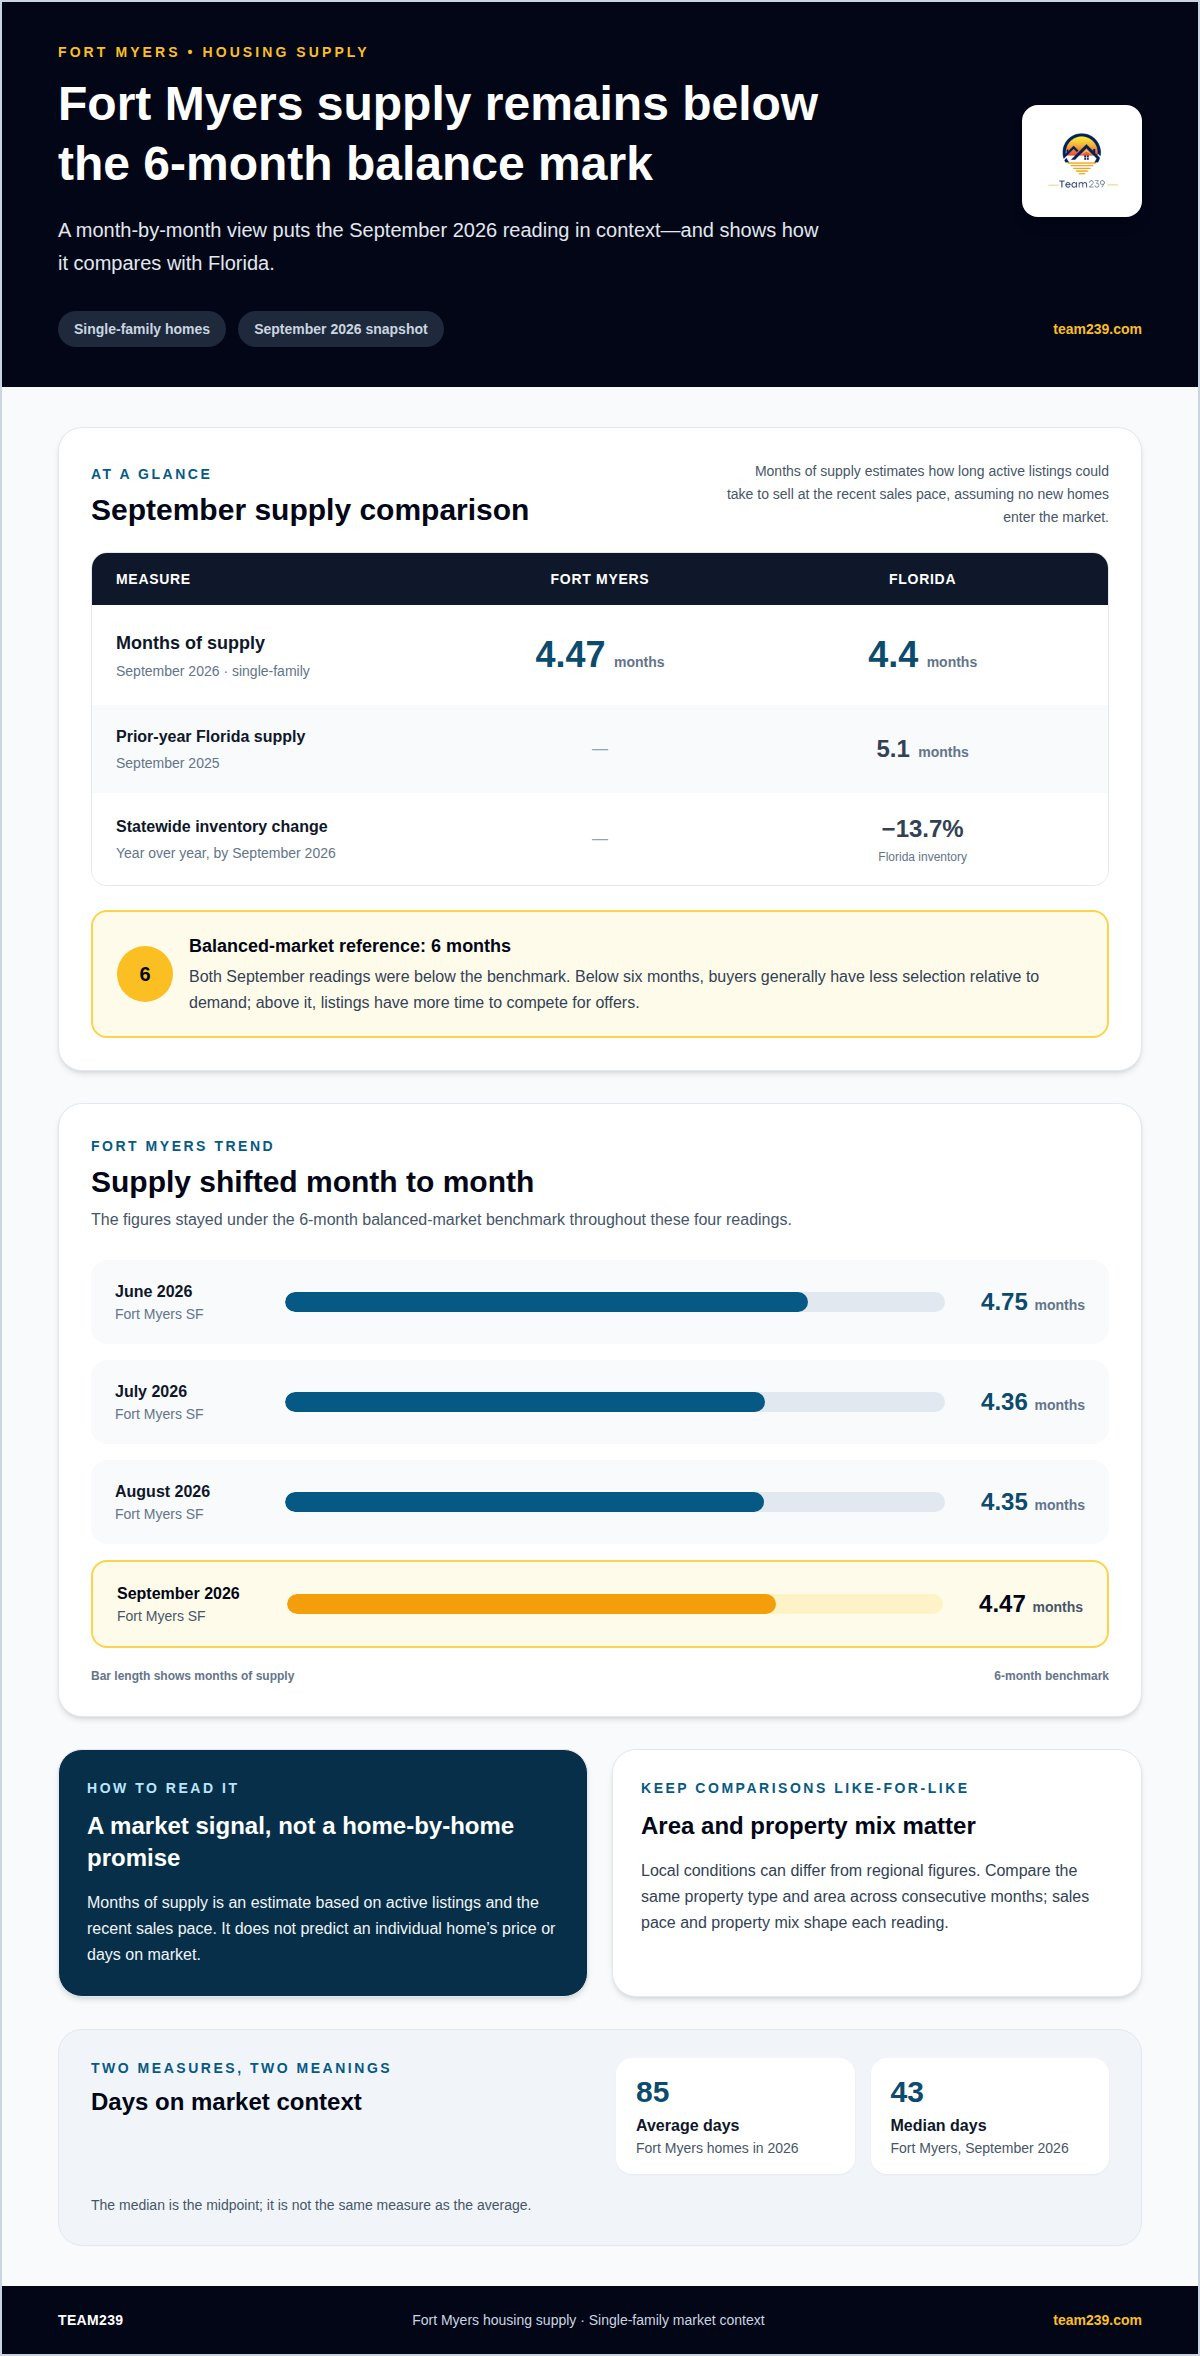
Fort Myers homes averaged 85 days on the market in 2026. In September, the median was 43 days, a different measure that describes the midpoint rather than the average.
Months of supply estimates how long current active listings would take to sell at the recent sales pace, assuming no additional homes enter the market. Six months is the balanced-market benchmark. Below that level, buyers generally have less selection relative to demand; above it, listings have more time to compete for offers. Treat the figure as a market signal, not a promise about an individual home’s price or days on market.
Fort Myers single-family supply shifted month to month: 4.75 months in June 2026, 4.36 in July, and 4.35 in August. That small decline followed by a near-flat reading shows why one month alone can mislead. September’s 4.47-month figure, covered earlier, marked a modest increase from August, while remaining below the six-month benchmark.
Florida’s single-family market had 4.4 months of supply in September 2026. Statewide inventory had fallen 13.7% year over year by that month; Florida’s inventory reading was 5.1 months in September 2025. These figures add context, but they don’t make Fort Myers, Naples, or another Southwest Florida market interchangeable. Property mix and local sales pace shape each monthly result.
For a three-to-six-month outlook, track monthly supply alongside new listings, pending sales, and median days on market. Rising supply can expand choices if sales do not accelerate at the same pace; falling supply can tighten competition. National housing headlines may miss these local shifts. Compare the same property type and area across consecutive months to see whether conditions in Southwest Florida are moving toward or away from balance.
Fort Myers and Southwest Florida housing inventory outlook
Fort Myers inventory in 2026 reflects several forces: buyer activity, limited resale supply, mortgage costs, and new construction. The lock-in effect keeps some existing homeowners in place, while suburban development adds another source of homes.
The outlook for 2027 points to inventory slowly trending down as buyers step up. That direction matters because Fort Myers supply remains below balanced-market levels for most price points. Buyers may find fewer options if demand grows faster than active listings. Sellers, meanwhile, can read a steady decline in available homes as a reason to monitor comparable listings and local pricing closely.
One less-visible measure also adds context. Greater Lee County’s Invisible Listings Index was 36.32% in Q3 2026. The figure indicates that visible active listings are only one part of the area’s housing picture. For a useful update, track new listings and pending activity alongside homes currently for sale. Changes in those measures can show whether supply is replenishing or buyers are absorbing available choices.
Mortgage conditions can shape both sides of the market. In early November 2026, Florida mortgage rates were back over 7%. Some Fort Myers sellers may offer rate buydowns that lower a buyer’s interest rate for the first 2 to 3 years. That can affect a buyer’s payment calculation without changing how many homes are available.
New construction is concentrated in Fort Myers suburban submarkets, creating a distinct supply channel alongside resale homes. Compare those options by location, timing, and property features rather than treating every listing as interchangeable. The market forecast calls for flat to modestly higher home prices through 2026, while inventory is expected to ease in 2027. Homeowners weighing a move may also consider how their mortgage and accumulated equity fit their plans. Together, these factors suggest a market with shifting choices, not a uniform trend across every price point.
How does Fort Myers inventory compare with Lee County and Florida overall?
In September 2026, Fort Myers had 1,548 active single-family listings and 4.47 months of supply. Florida’s statewide single-family supply was 4.4 months that month. The figures are close, but they describe different geographic markets. A statewide reading can provide context, not a substitute for assessing Fort Myers homes and local demand.
Lee County’s active listing count offers another perspective, but the available regional snapshot is from November 2025. Its daily average was 11,692 active listings, compared with 6,174 in Collier County. Together, the two counties averaged 21,871 active listings across the region. These counts cover a different period and geographic scale than Fort Myers’s September figures, so they shouldn’t be treated as direct equivalents.
The Cape Coral-Fort Myers metro area recorded 9,173 active single-family and condo/townhome listings in September 2026. That count covers more property types and a wider area than Fort Myers’s city-level single-family total. The difference illustrates why buyers should compare like with like: city to city, property type to property type, and month to month.
Florida’s inventory reading was 5.1 months in September 2025, then fell 13.7% year over year by September 2026. That statewide movement helps frame the broader trend, while Fort Myers’s 4.47 months shows how local supply can differ. For a practical comparison, line up three measures for the same month: active listings, months of supply, and property category. Then review whether the area is gaining listings or absorbing them through sales.
These distinctions matter if you’re comparing a Fort Myers home with options elsewhere in Lee County or Florida. Use consistent dates and property types before drawing conclusions about buyer leverage. For help interpreting local inventory across Southwest Florida, get a local market perspective.
Team239
Team239 helps buyers and sellers turn Fort Myers inventory trends into informed property decisions. If you’re weighing resale homes against new construction, the team provides Residential Resale Representation and New Construction Buyer Representation. Relocation Consulting can help connect a move with local market conditions, while Luxury Property Listing Services support sellers preparing a property for the market.
Consider reaching out when you’re ready to define your target area, compare property options, or plan a sale alongside a purchase. A focused conversation can help clarify which market signals matter most to your goals, from available homes to pricing shifts.
Contact Team239 to discuss your Fort Myers real estate plans.
Make Your Next Fort Myers Move With a Clear Plan
Let inventory trends inform your timing, but anchor the decision in the home and priorities that matter to you. The Fort Myers housing inventory levels in 2026 offer useful context; your next step is to define the location, property type, and trade-offs that fit your plans. A focused strategy can help you assess resale options, consider new construction, or prepare a luxury property for listing.
Team239 supports buyers and sellers through Residential Resale Representation, New Construction Buyer Representation, and Luxury Property Listing Services. If a move to Southwest Florida is part of your plan, Relocation Consulting can help connect your transition with local real estate decisions.
Share what you’re planning and what matters most. Contact Team239 to discuss your plans, and take the next step with a clearer direction.
Frequently Asked Questions
What is the current housing inventory in Fort Myers in 2026?
The latest metro-wide count in the figures here is 9,635 active listings in October 2026. It covers single-family homes and condos or townhomes across Cape Coral-Fort Myers, not Fort Myers city alone. For the city, the September 2026 count was 1,548 active single-family listings. Keep the geography and property types aligned when using either number to assess your options.
How many months of housing supply does Fort Myers have in 2026?
Fort Myers had 4.47 months of single-family supply in September 2026. This measure relates active homes to the recent pace of sales, so shifts in either listings or sales can change the reading. For context, Florida’s single-family supply was 4.4 months that month. Buyers comparing areas should match the month and property category, rather than treating a statewide figure as a city-level measure.
How has Fort Myers housing inventory changed year over year?
Nearby year-over-year indicators show different directions. Bonita/Estero had 2,206 active listings in January 2026, down 8.6% year over year, while Florida’s inventory fell 13.7% year over year by September 2026. These figures describe different locations and periods, so they don’t establish Fort Myers city’s annual change. For a local decision, compare the same Fort Myers property type across matching months.
How do inventory levels differ between Fort Myers single-family homes and condos?
Fort Myers’s city-level figure cited here counts single-family homes: 1,548 active listings in September 2026. The Cape Coral-Fort Myers metro count combines single-family listings with condos and townhomes, totaling 9,635 in October. That combined number doesn’t separate condo inventory. To compare property types meaningfully, use separate counts for the same geography and month, then consider each type’s sales pace.
Are Fort Myers home listings increasing or decreasing in 2026?
The direction changed during the year. Cape Coral-Fort Myers metro active listings declined from 10,575 in June to 9,173 in September 2026, then rose to 9,635 in October. Fort Myers city single-family inventory also increased by 44 listings in September compared with August. These movements show why buyers should check the latest monthly count instead of assuming a year-long rise or fall.
How do seasonal trends affect Fort Myers housing inventory?
Seasonal timing can influence how quickly listings attract buyers. In Olde Naples, buyer activity is strongest roughly from October through April; from May through September, seasonal buyers are gone and listings sit longer. This local pattern offers context for Southwest Florida, but it is not a Fort Myers-specific inventory count. Consider listing activity alongside location, property type, and the month being reviewed.
Comments